Sentinus Research Academy 2026

Biomedical Science

Who is at risk of heart disease?

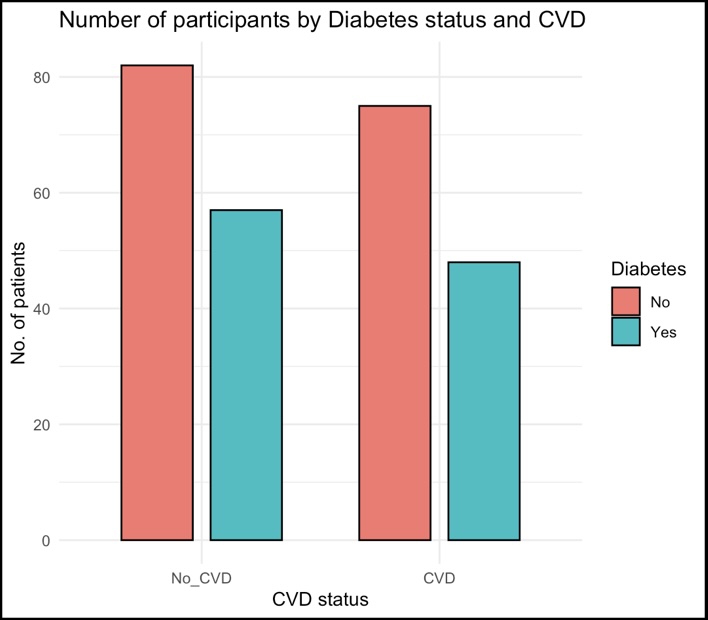
Students will explore real anonymised patient data to investigate how smoking, alcohol, and weight relate to cardiovascular disease (CVD).

What Students Will Do:

  • Work with a real biomedical dataset provided by Queen’s University Belfast.
  • Use Microsoft Excel to organise data, calculate averages, and make charts.
  • Learn how scientists use data to spot health patterns in patients.
  • Explore concepts like chi-squared analysis (explained simply as a way to check if two things are linked — e.g., smoking and heart disease).
  • Create a research poster to showcase their findings and a research report.

Students complete the same analysis in R programming.  Full resources and guidance are provided to explain R step by step, including how to produce a bar chart like this example:

Biomedical Science Bar Chart

Skills Developed:

  • Data Literacy – Learning to handle real health data, calculate averages, and interpret findings.
  • Digital Skills – Using Excel for analysis, charts, and tables.
  • Research Awareness – Understanding how biomedical science investigates real health problems.
  • Critical Thinking – Drawing conclusions from numbers and patterns.
  • Communication – Summarising findings clearly on a professional-style poster.
  • Teamwork – Collaborating in pairs or groups to complete tasks.

Future Preparation:

  • Introduces digital skills useful in medicine, nursing, biomedical science, and healthcare careers.
  • Embeds IT and coding principles — understanding formulas in Excel is the first step towards coding and digital analysis.
  • Gives a university-style research experience at Transition Year level.
Read more

Chemistry

Can chemistry help us fight superbugs?

What Students Will Do:

  • Learn why antibiotic resistance is one of the world’s biggest health challenges.
  • Explore different ways new antibiotics might be discovered (e.g., from nature, lab synthesis, or computer design).
  • Work with a simplified dataset of antibiotics that includes key features like:
  • Which bacteria they target
  • How effective they are
  • Cost or ease of production
  • Use Microsoft Excel to:
  • Compare different antibiotics on simple features (tables and charts).
  • Create bar charts showing which options look most effective.
  • Rank antibiotics by key properties (e.g., effectiveness vs. cost).
  • Complete a research report and poster

Optional Pathway: Try doing the same in R programming, with step-by-step help to load the dataset and create a bar chart.

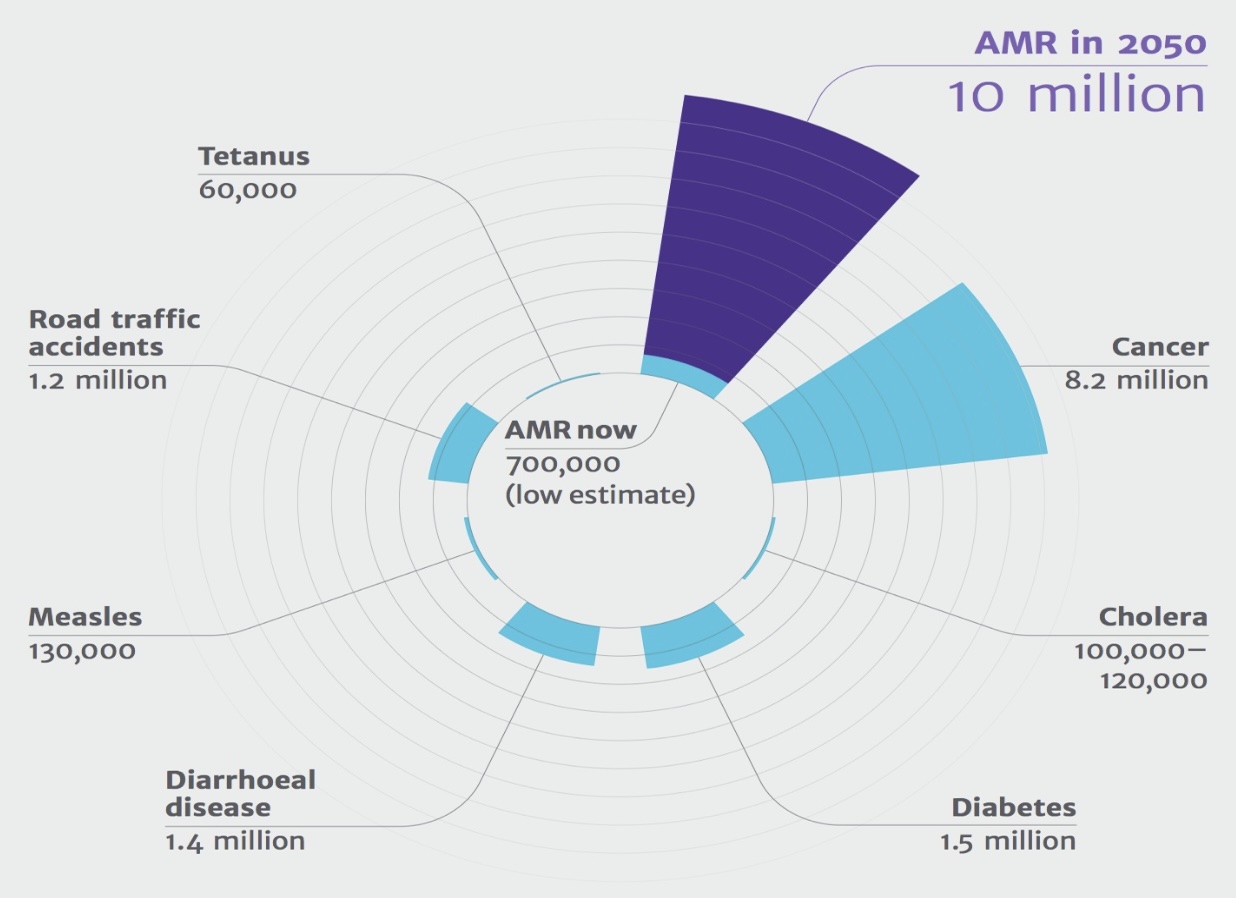
This chart was created by a student in a previous Chemistry research project. It shows the predicted global impact of antimicrobial resistance (AMR) compared to other major causes of death.

Chemistry Chart

Skills Developed:

  • Chemistry Awareness – Learn how new medicines are discovered and tested.
  • Data Literacy – Compare properties of different antibiotics using real-world style information.
  • Digital Skills – Use Excel (and optionally R) for tables and charts.
  • Critical Thinking – Weigh up pros and cons of different scientific approaches.
  • Communication – Present results clearly on a professional-style poster.
  • Teamwork

Recommended Background:

An interest in Science, Maths, or IT will help.
Students who enjoy problem-solving and real-world applications of science will find this project exciting.

Future Preparation:

  • Builds confidence and foundation for a university degree in any related subject
  • Introduces how chemistry research connects to medicine, healthcare, and global challenges.
  • Embeds IT and coding foundations, showing how data supports modern chemistry.
  • Provides a university-style research experience.
Read more

Computer Science

Can computers see like humans? Exploring Object Detection and Artificial Intelligence.

What Students Will Do:


Students will explore how computers can identify objects in images and videos — from people and cars to animals and everyday items. Using real-world examples (like traffic cameras or medical imaging), they’ll see how artificial intelligence is trained to recognise patterns.
They’ll work in MATLAB or Python to label a short video and visualise how the computer detects movement, classifies objects, and tracks them across frames.

Students will:

  • Learn how image data is processed and labelled.
  • Apply a simple AI model (pre-trained) to detect and classify objects.
  • Analyse their results using tables and graphs in Excel or Python.
  • Produce a research report and poster showcasing their findings.

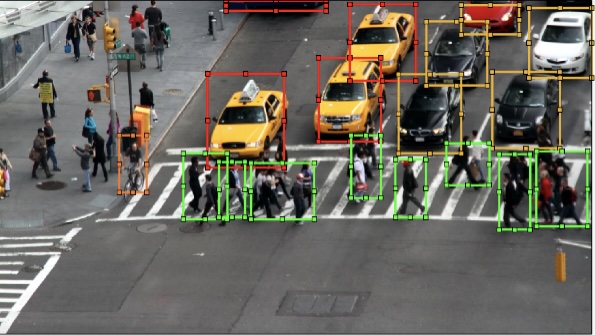
This is a screenshot from a previous student’s project showing computer vision detecting vehicles and pedestrians in a city video using MATLAB’s Video Labeller.

Computer Science

Skills Developed:

  • Computer Science & AI Awareness – Understand how artificial intelligence and computer vision work.
  • Digital Skills – Learn coding basics in MATLAB or Python for data and image analysis.
  • Data Literacy – Work with real-world datasets and interpret results visually.
  • Problem Solving – Investigate how algorithms recognise and respond to patterns.
  • Communication – Summarise and present findings clearly on a poster.
  • Teamwork – Collaborate to divide roles (data, coding, presentation).

Recommended Background:

An interest in Computing, Maths, or Science will help. No prior coding experience needed — step-by-step guides are provided. Perfect for students who enjoy logic, design, or understanding how AI makes decisions.

Future Preparation:

  • Builds confidence for studying Computer Science, AI, or Data Science at university.
  • Demonstrates how AI supports real-world fields like healthcare, transport, and safety.
  • Provides experience with university-level tools (MATLAB/Python) used in research and industry.
Read more

Data Science

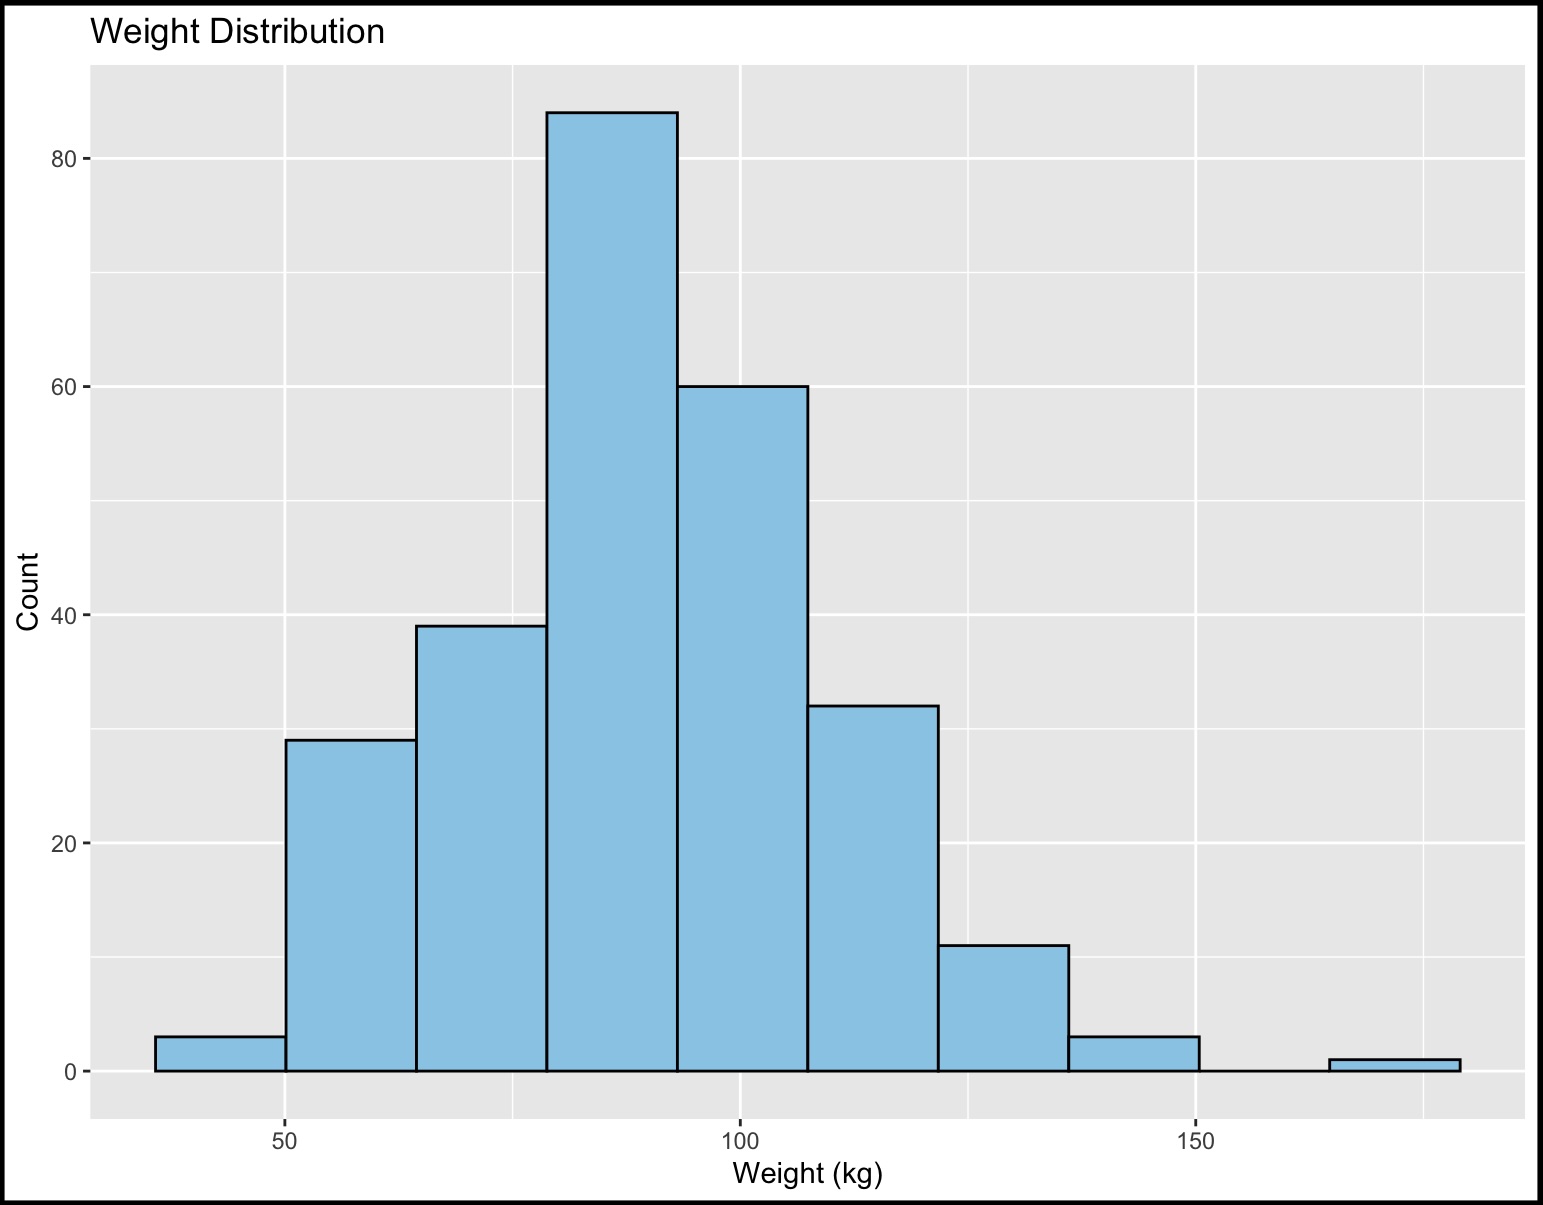
How can we use data to spot patterns in health?

What Students Will Do:

  • Work with a real health dataset provided by our university partners.
  • Use Microsoft Excel to explore the data — spotting missing values, counting groups, and making simple charts.
  • Learn how to take a sample (a smaller group from the data) and see how well it represents the whole.
  • Use basic probability to answer questions like:
“What is the chance someone has heart disease?”
  • Create visualisations like bar charts and histograms to show patterns.

You will complete the same tasks in R programming with full step-by-step resources. Students can learn how to load data and make their first chart in R.

Data Science Chart

Skills Developed:

  • Digital Skills – Using Excel (and optionally R) to clean and explore real data.
  • Data Literacy – Understanding how information can be organised, sampled, and visualised.
  • Critical Thinking – Asking questions like: “Is this difference real, or just by chance?”
  • Maths in Action – Using probabilities and simple calculations on real numbers.
  • Communication – Explaining findings clearly with a chart and one-sentence summary.
  • Confidence with STEM – Seeing how coding and data analysis prepare them for higher study.

Recommended Background:

  • No prior coding experience is required — full support and resources are provided.
  • An interest in Maths, Applied Maths, Business, or IT will be an advantage.
  • Students who enjoy solving puzzles, working with numbers, or using computers will find this project especially engaging.

Future Preparation:

  • Introduces data handling skills valuable for science, business, economics, and computing.
  • Embeds IT and coding foundations — showing how Excel formulas are like the first steps toward programming.
  • Provides a university-style research experience, simplified for TY level.
Read more

Environmental Biology

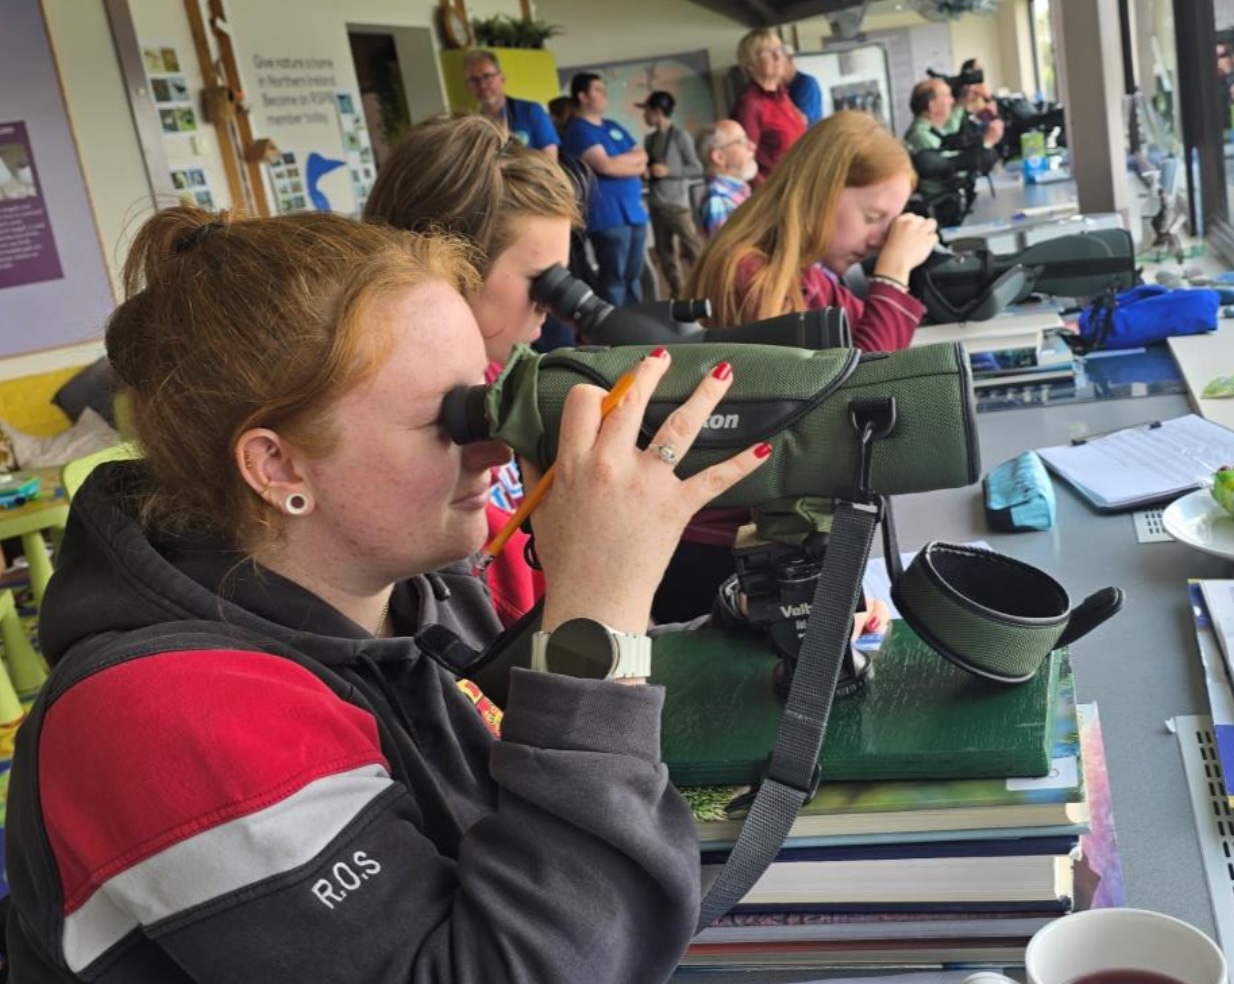
Can fieldwork help protect our seabirds? Studying biodiversity and conservation in Northern Ireland.

What Students Will Do:

Join a real-world conservation study exploring how environmental changes affect local bird populations and their habitats. Working alongside professional researchers, students will collect and analyse field data from two outdoor research sites — RSPB Belfast Window on Wildlife (WoW) and Lurgan Park.

Students will:

  • Observe and record biodiversity indicators such as bird activity, vegetation, and habitat features.
  • Collect ecological data in the field using binoculars, identification guides, and data sheets.
  • Analyse findings in Microsoft Excel to identify trends and visualise biodiversity levels (bar charts, pie charts, and line graphs).
  • Discuss conservation challenges such as climate change, pollution, and habitat loss.
  • Complete a professional-style research report and poster to present findings.

Environmental Biology

Skills Developed:

  • Environmental Awareness – Understand how fieldwork data supports wildlife conservation and sustainability.
  • Scientific Methodology – Learn real research skills: observation, sampling, data collection, and analysis.
  • Data Literacy – Use Excel for summarising and visualising environmental data.
  • Critical Thinking – Explore how human activity impacts ecosystems and biodiversity.
  • Communication – Present scientific findings clearly and persuasively.
  • Teamwork – Work collaboratively during field studies at two distinct ecological sites.

Recommended Background:

An interest in Biology, Geography, or Environmental Science will be helpful. Ideal for students who enjoy the outdoors, wildlife, and real-world problem-solving. No previous experience required — all training and equipment provided.

Future Preparation:

  • Builds confidence for future study in Environmental Science, Biology, or Ecology.
  • Introduces fieldwork and data analysis, key skills for university and environmental careers.
  • Connects students to real conservation work with organisations like RSPB and local councils.

Additional Details:

📍 Field Sites: Belfast Window on Wildlife (RSPB) and Lurgan Park
👥 Places Available: 4 students
🧭 Focus Areas: Biodiversity, bird conservation, environmental change
💻 Software Used: Microsoft Excel (for data and graphing)

Read more

Neuroscience

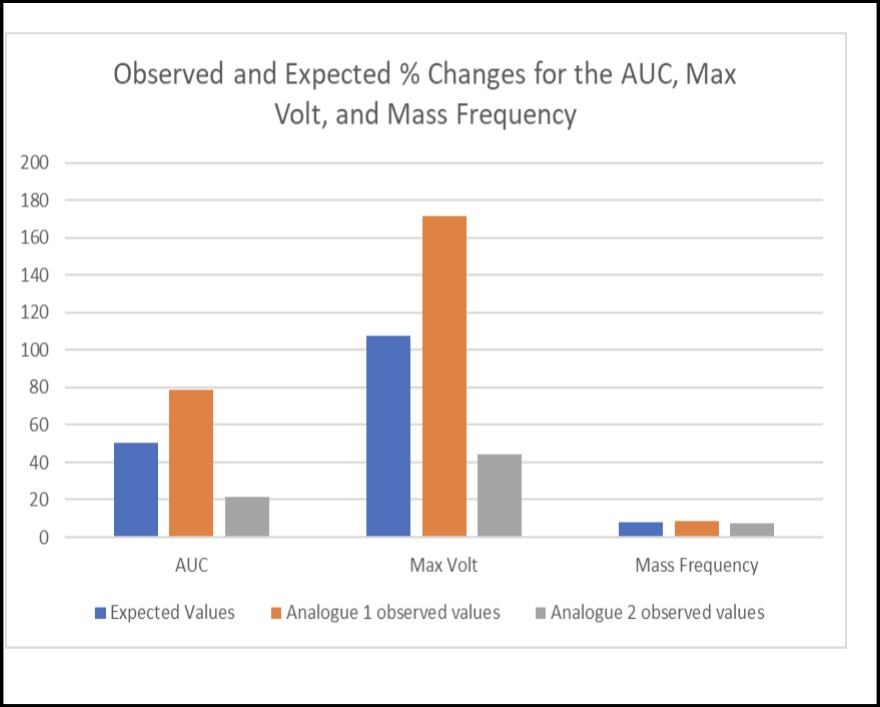
Can vitamins change how the brain works?
(Based on research from Trinity College Dublin on Vitamin K and epilepsy)

What Students Will Do:

  • Learn about epilepsy – a condition were sudden changes in brain activity cause seizures.
  • Explore how scientists study the brain’s electrical signals and why certain vitamins (like Vitamin K) might help.
  • Work with a simplified dataset showing brain activity levels with and without Vitamin K treatment.
  • Use Excel to:
    • Compare average brain activity across groups.
    • Create bar charts to show differences.
    • Discuss whether vitamins could influence brain health.
  • Optional Pathway: Try the same tasks in R programming, with simple step-by-step resources for loading the data and creating a chart.

What students can produce:

Neuroscience

Skills Developed:

  • Neuroscience Awareness – Understanding brain activity is measured and linked to epilepsy.
  • Data Skills – Using Excel (and optionally R) to calculate averages and make charts.
  • Critical Thinking – Asking questions like: “Does Vitamin K really make a difference?”
  • Research Experience – Following the same process scientists use, but at a simplified TY level.
  • Communication – Presenting results clearly on a professional-style poster.
  • Teamwork – Working in small groups to analyse and discuss findings.

Recommended Background:

  • No prior neuroscience is needed — everything is explained simply.
  • An interest in Science, Biology, or Maths will be helpful.
  • Curiosity about how the brain works or how drugs and nutrients affect the body will make this project exciting.

Future Preparation:

  • Introduces students to brain science and epilepsy research, an area with real-world medical importance.
  • Embeds IT and coding skills, showing how data analysis supports modern neuroscience.
  • Provides a university-style research experience connected to cutting-edge work at Trinity College Dublin.
Read more

Psychology

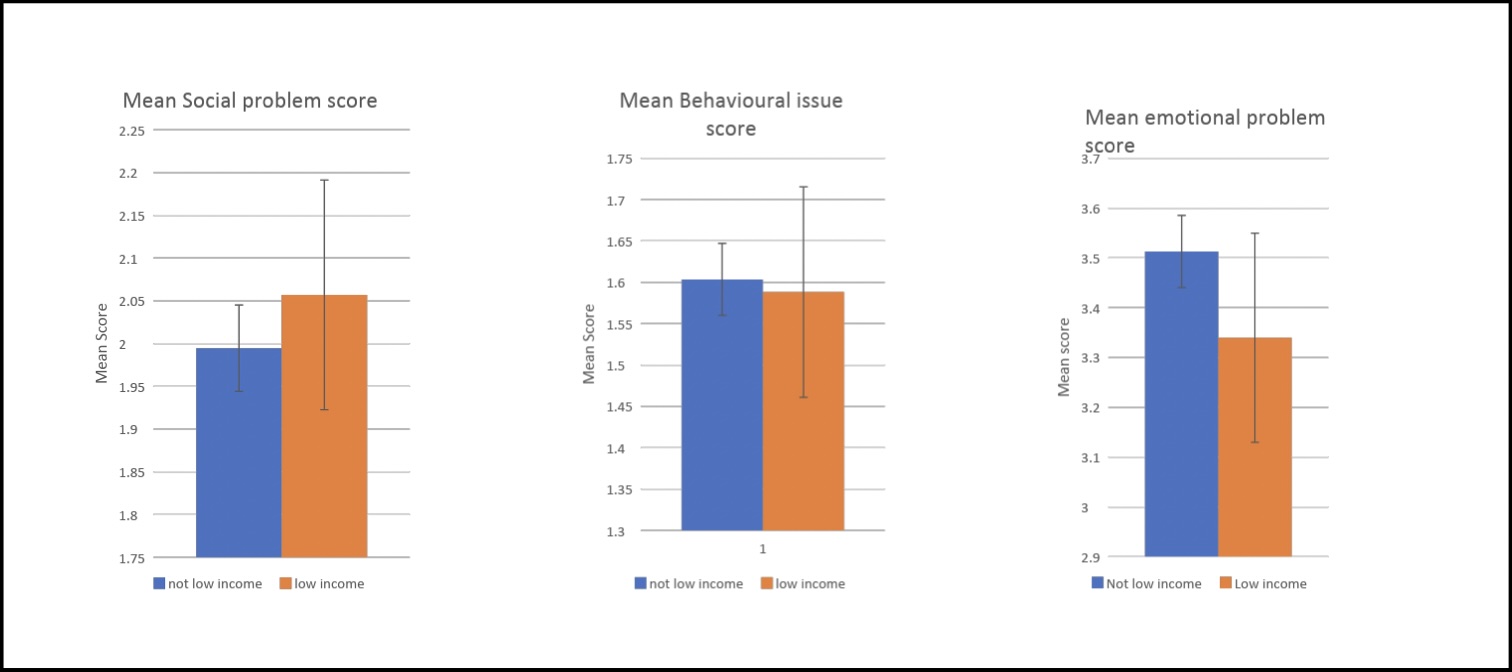
Do lifestyle factors relate to wellbeing in young people?

What Students Will Do:

  • Work with a dataset provided by ulster university based on young people in Northern Ireland.
  • Explore whether everyday factors (like age, gender, or general life experiences) are linked to whether a young person reports feeling well or needing support.
  • Use Microsoft Excel to:
    • Count how many participants reported wellbeing challenges.
    • Make simple bar charts to compare groups (e.g., younger vs older).
  • Learn about chi-squared analysis in a simplified way — explained as a test that checks if two things are linked (e.g., wellbeing).
  • Present findings on a poster and research report
  • Complete same tasks in R programming, with resources showing step-by-step how to load the data and create a chart.

What your students can produce by the end of the project:

Psychology Chart

Skills Developed:

  • Psychology Awareness – Understanding how researchers study wellbeing and resilience.
  • Data Literacy – Counting, comparing, and visualising patterns in survey data.
  • Digital Skills – Using Excel (and optionally R) to analyse and present findings.
  • Critical Thinking – Asking: “Are certain groups more likely to report challenges?”
  • Communication – Explaining patterns clearly on a professional-style poster.
  • Teamwork – Working in pairs or groups to discuss and present findings.

Recommended Background:

  • No psychology background is needed — everything is explained in simple terms.
  • An interest in Social Science, SPHE, or Maths/Statistics will be helpful.
  • Students who enjoy exploring questions about people, behaviour, and wellbeing will find this project especially rewarding.

Future Preparation:

  • Introduces research skills that are central to careers in psychology, healthcare, and education.
  • Embeds digital and analytical skills that prepare students for higher study.
  • Offers a university-style experience in an age-appropriate way.
Read more

Renewable Engineering

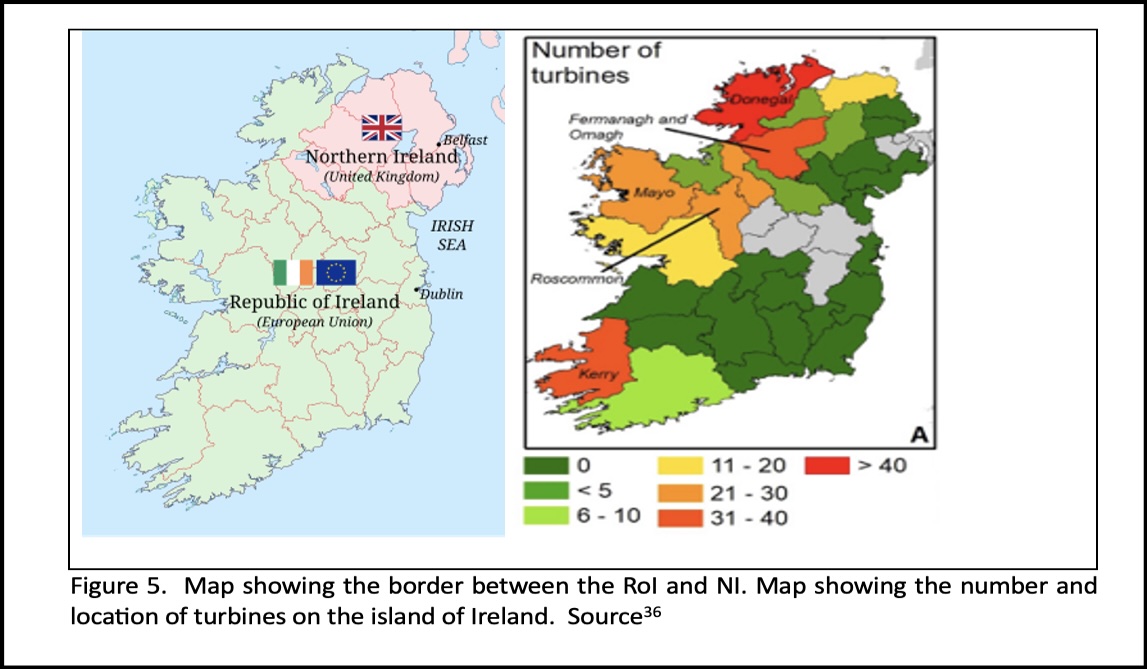
Turning Wind into Power: How Much Can We Harness?

What Students Will Do:

  • Learn why wind energy is one of Ireland’s most important renewable resources.
  • Use real wind data from Dundalk Institute of Technology to answer questions like:
    • How often does the wind blow strongly at this site?
    • Which wind direction is most common?
    • How does wind speed affect how much power a turbine can produce?
  • Analyse the data in two possible ways:
    • Excel Pathway – Calculate averages and ranges, make a histogram of wind speeds, and plot a simple power curve using built-in chart tools.
    • MATLAB Pathway – Run short, step-by-step code to produce the same charts and explore how engineers use coding to analyse renewable energy.
  • Present results on a poster, showing charts, findings, and a short explanation.

The map shown here was created by a previous student as part of their Renewable Energy project. It shows the number and location of wind turbines across Ireland.

Renewable Energy

Skills Developed:

  • Engineering Awareness – Learn how engineers measure wind energy potential.
  • Maths in Action – Apply averages, ratios, and percentages to real energy data.
  • Digital Skills – Use Excel for data analysis and charts.
  • Coding Skills – Gain first experience with MATLAB, used in engineering and data science.
  • Problem Solving – Ask and answer questions about renewable energy performance.
  • Communication – Create a clear, professional-style poster.
  • Teamwork – Work together in pairs or groups to analyse and present findings.

Recommended Background:

  • No prior coding experience is required — all MATLAB commands will be provided.
  • An interest in Maths, Physics, or IT will be a big advantage.
  • Students who like problem-solving, coding, or sustainability will especially enjoy this project.

Future Preparation:

  • Introduces students to Excel and MATLAB, tools widely used in universities and industry.
  • Connects to renewable energy and climate solutions, highlighting careers in engineering and sustainability.
  • Provides a university-style research experience, simplified for TY.
Read more

Registrations now open

Secure your place on the 2026 Research Academy—spaces are limited.

Sign up for future promotions, offers and programme updates

By submitting this form I accept the Privacy Policy of this site.

We're now recruiting for STEM and Digital Skills Programme Facilitators.